Open Letter to Service Academy Graduates at the 2021 Service Academy Global Summit
My hope is Service Academy graduates will rally to act before the US follows Syria into Oil Famine. So far Syria experienced a 20% decrease in population.
Oil Famine occurs when two factors combine:
- An economy has a monolithic dependence on oil energy.
- Capital to sustain the long and complex oil supply chain collapses.
Oil Famine is not about a lack of oil. Syria and Venezuela have considerable oil resources and are experiencing Oil Famine. I use Syria as an example because it started its trigger point is 5 years earlier than Venezuela.
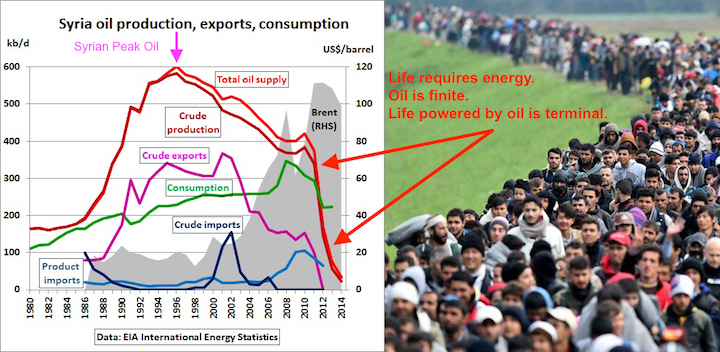
Life requires energy. Less energy less life. Steps to Oil Famine in Syria:
- Syria Peak Oil was in 1996
- Domestic consumption of oil increased to approach domestic production capacity in 2008. This decreased the amount of cash the government had to sustain its economy and social structures.
- By 2008 conditions began to noticeably deteriorate and oil revenues were consumed by domestic consumption.
- By 2010, financial constraints created enough unrest to trigger the Arab Spring.
- With the Arab Spring, capital structures supporting oil production collapsed.
- By 2014 access to oil energy had decreased by over 90%.
- In the chaos, straight out of a Mad Maxx, ISIS scaled to scavenge on the remnants.
- Mass migrations reminiscent of the Irish Potato Famines and wars occurred.
- Syria's population of 21.36 million in 2010 decreased to 16.91 in 2018.
The capital structure of the US oil industry is collapsing:
- The US oil industry is substantially in bankruptcy having lost $342 billion (Bloomberg, July 2020).
- Link to a google search on "fracking bankruptcies".
- US oil production is down 2 million barrels a day (EIA) from 13 mb/d a year ago to 11 mb/d. US Rig Count determines future production.
- At least 1,000 rigs are needed to sustain the US economy 18 months before the gasoline is needed. US Rig Count is at 461, 2021-06-14, and this is the High for the last year.
- Blue-line is the last 12 months, and Brown-line is 24 months to 12 months ago:
- US gasoline consumption is back to pre-COVID levels (EIA). The Law of Supply and Demand is forcing gasoline prices higher. A 2 mb/d decrease in supply with a zero decrease in demand. This is a bigger supply cut than the 1973 Oil Embargo. Blue-line is the last 12 months, and Brown-line is 24 months to 12 months ago:
- Gasoline prices are at their High since 2014. With 2 million barrels a day less production, it seems the Law of Supply and Demand will push them still higher. As oil fields deplete, supply will decrease further without 1,000 Rigs in the field 18 months ago.
- If gasoline prices rise to save the industry, gasoline prices will rise. Traditionally unemployment rises about 18 months after gas price increases.
- My wild guess is 2022 gas is painfully expensive and 2023 gas prices replay the Sept 2008 nightmare.
- "It is hard to predict, especially about the future" Yogi Berra

Background on 2008:
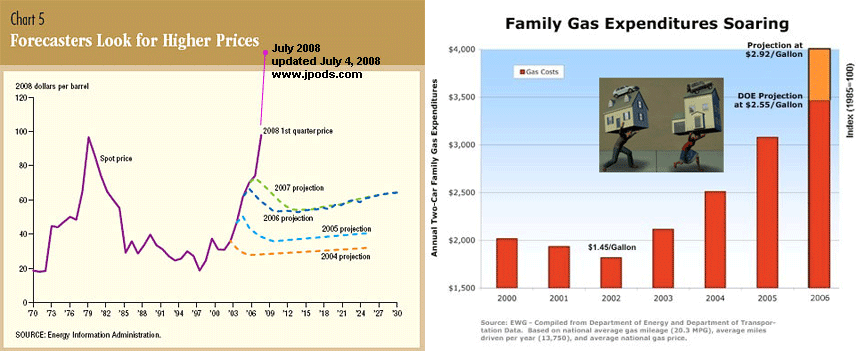
- As noted by the Dallas Federal Reserve in May of 2008, "Crude Awakening: Behind the Surge in Oil Prices", EIA is terrible at realistically warning US policymakers about by gas prices will become unaffordable to vast numbers of Americans.
- EIA repeatedly forecast that prices would stabilize while families saw their disposable income spent on gasoline (these are graphs I used to brief McCain and Obama Senate staffs in July 2008. I showed that enough families were using their mortgage payments to buy gasoline to keep their jobs, that foreclosures were skyrocketing.
- Only Bud McFarlane (former National Security Advisor and advisor to the McCain Presidential campaign) saw the risks. Others thought the Federal government policies could manage the foreclosure issue.
- In Sept 2008 foreclosures collapsed the banking system. And the Great Recession set in driving unemployment higher and gasoline consumption down.
Fracking Boom:
- The Federal response to the Great Recession was Quantitative Easing (zero-interest rates), vast Federal borrowing, and money printing.
- These policies forced pension funds and other large investors to seek riskier investments.
- $billions were invested in Fracking (read Saudi America by Bethany McLean).
- As noted in the Bloomberg article above Frackers have since lost $342 billion and investors are pulling away from further investments.
- So there is little capital available, without a massive amount of government funds, to increase the Rig Count back to 1,000 (currently 461) to compensate for depleting oil fields in 12-18 months.
Timeline on the crisis in the US.
-
- This is a wild guess based on the data above.
- US Peak Oil was in 1970. If you would like a more complete explanation of the graph below, let me know.
- Excellent 19 minute summary of Energy Economics. The entire Crash Course is valuable. It would be worthwhile to have Chris Martenson provide data directly.
- Talking about the future has a Cassandra Problem. We have ignored the facts for more than half a century. Only President Nixon actually did anything about this crisis. Link to Tricia Nixon opening the Morgantown PRT is 1972 and Congressional Study 1975.
- Because the US has the World's Reserve Currency, after US Peak Oil we were able to mortgage the future labor of our children to buy foreign oil and fund oil-wars (red line in the graph below, and see attached Kids Declaration of Liberty). If we lose the world's Reserve Currency, the capacity to buy foreign oil with printed dollars will likely evaporate.
- The Law of Supply and Demand indicates that gasoline prices will be high sometime in 2022 and unbearable sometime in 2023, that is 2008 levels of crisis.
- Open Letter to my Classmates 4 years ago on this issue, geology is slow with massive momentum.
- Recent Open Letter to you that:
- The US military has known this crisis was coming since Admiral Rickover in 1957 and General Mattis in 2010.
- Eight Presidents issued unanswered calls to action.
- We have done nothing to answer these survival necessities and subordinated the survival of America to foreign oil addiction.

If you can find some defect in my understandings please correct me. I will publish such a correction. I would love to be wrong about this.
Bill
bill.james@jpods.com